Executive Summary
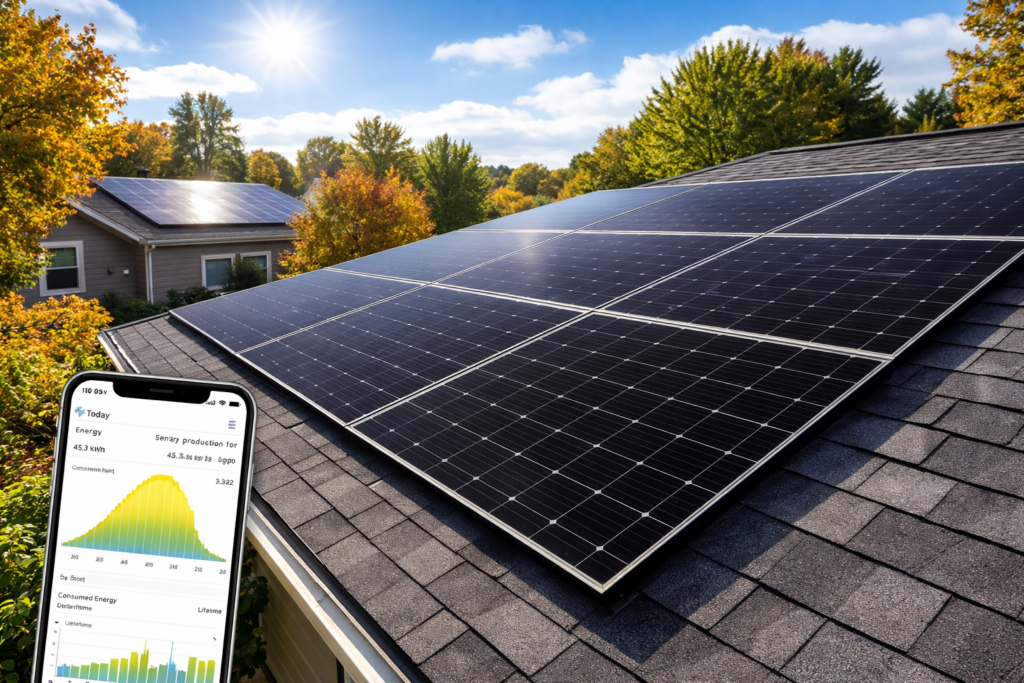
If you regularly check your solar monitoring app—whether it’s Enphase Enlighten, SolarEdge Monitoring, or another platform—you may have noticed:
- Your system doesn’t always hit the panel’s rated output
- Some days show a flat “plateau” at peak production
- Production varies even on sunny days
All of this is completely normal.
👉 These patterns are the result of real-world conditions and intentional system design, not a problem.
👉 Your system is designed to maximize total energy—not peak output.
Why Your Panels Rarely Hit Their Rated Output
Most panels are rated:
- 430W
- 440W
- 460W
These ratings are based on STC (Standard Test Conditions):
- 77°F
- Perfect sunlight
- Ideal angle
👉 These conditions almost never happen on your roof.
Real-World Output (What You Actually See)
In reality:
- Roof temps hit 120–140°F
- Heat reduces output by 10–20%
- Sun angle + weather reduce output
👉 A 440W panel typically produces:
- 250W–380W most of the day
- Only briefly approaches peak
Real Example: Daily Production Curve
This is what your monitoring app is actually showing:
| Time | Output |
|---|---|
| 8 AM | 120W |
| 10 AM | 280W |
| 12 PM | 360W |
| 1 PM | 400W (brief peak) |
| 3 PM | 300W |
| 5 PM | 150W |
👉 Most production happens below nameplate rating
DC-to-AC Ratio: The Foundation of System Design
👉 DC (panel watts) ÷ AC (inverter capacity)
Typical Range:
1.15 – 1.35
Real Sizing Examples (This is How Systems Are Designed)
Example 1 – Optimized System (Enphase Typical)
- Panel: 440W
- Microinverter: ~330W (IQ8M)
- Ratio: 1.30
👉 Result:
- Slight clipping at peak
- Maximum annual production
Example 2 – “Perfect Match” (Not Ideal)
- Panel: 440W
- Inverter: 440W
- Ratio: 1.0
👉 Result:
- No clipping
- Lower overall energy production
Example 3 – Oversized Inverter (Worst Case)
- Panel: 440W
- Inverter: 500W+
- Ratio: <1.0
👉 Result:
- No clipping
- Poor efficiency
- Less total energy
Annual Production Comparison
| Design | Annual Output |
|---|---|
| Oversized Inverter | ❌ 9,500 kWh |
| “Perfect Match” | ⚠️ 10,000 kWh |
| Optimized (with clipping) | ✅ 10,500–10,800 kWh |
👉 This is why clipping is intentional
What is Clipping?
Clipping occurs when:
Panel output exceeds inverter capacity
Example:
- Panel = 400W
- Inverter = 330W
- 70W is “clipped”
Why Clipping is a GOOD Thing
1. It Only Happens at Peak
- Midday
- Best weather conditions
- Few hours per year
2. It Boosts Real-World Production
Oversizing panels increases output during:
- Morning
- Late afternoon
- Cloudy days
- Winter
👉 These hours drive most of your energy savings
3. Net Result = MORE ENERGY
Even with clipping:
- Higher total daily production
- Higher yearly output
- Better ROI
👉 You gain more than you lose
What Happens if the Inverter is Oversized?
This is where many people get it wrong.
Problems with Oversizing the Inverter
❌ Lower efficiency
Inverters run best near capacity
❌ Less production
Weak output during most of the day
❌ Later startup / earlier shutdown
Lost energy morning + evening
❌ Higher cost, worse ROI
Sizing Summary
| Approach | Result |
|---|---|
| DC > AC (oversized panels) | ✅ Best performance |
| DC = AC | ⚠️ Average |
| DC < AC (oversized inverter) | ❌ Worst |
Why Your Production Changes Daily
Your monitoring app reflects:
☀️ Weather
🌡️ Temperature
📐 Sun angle
🌳 Shading
Why Panels Perform Differently
Panel-level differences (especially in Enphase) are normal due to:
- Orientation
- Shading
- Minor variation
All of This Was Modeled in Your Design
Your system was designed using:
- Aurora Solar
- PVWatts (NREL)
Accounting for:
✔ Temperature losses
✔ Orientation + pitch
✔ Shading
✔ Weather
✔ System losses
👉 Your system is performing based on real-world expectations
Panel Types You May Have
- REC (460W)
- Hyundai (440W)
- Q CELLS (430W)
- Jinko (430W)
- JA Solar (440W)
👉 All Tier 1 → performance differences are minimal in real-world use
What You SHOULD Look For in Your Monitoring App
Focus on:
✅ Smooth bell curve
✅ Consistent daily output
✅ Seasonal trends
✅ No major dropouts
Final Takeaway
Solar systems are designed for real-world performance—not peak output
- STC ratings are theoretical
- Real output is lower
- Clipping is normal and beneficial
- Oversizing panels improves production
- Oversizing inverters reduces it
👉 If your system is consistent over time, it’s working exactly as intended.